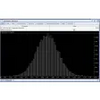
View and analyze stock market data charts using advanced technical studies
View and analyze stock market data charts using advanced technical studies
Vote: (1 votes)
Program license: Free
Developer: Advanced Data Analytics, Inc.
Version: 1.4.0.42
Works under: Windows
Vote:
Program license
(1 votes)
Free
Developer
Version
Advanced Data Analytics, Inc.
1.4.0.42
Works under:
Windows
Robust Analysis for Every Investor: inteliCharts
inteliCharts positions itself as a versatile stock market charting software that aims to provide robust technical analysis tools for traders and investors. With its dynamic charting capabilities, users benefit from real-time intraday snapshot price information, empowering them to make informed decisions.
Feature-Rich Technical Analysis
Integrating the latest technical indicators, oscillators, and overlays, inteliCharts is a solid choice for anyone demanding comprehensive analytical tools. It boasts a custom input parameters editor, allowing users to fine-tune their strategies to their exact specifications. The over 70 technical indicators available further enhance its reliability as a software that meets various analytical needs without additional costs.
Dynamic Drawing and Charting Tools
The advanced drawing tools feature line magnets and parallel line cloning adaptable to logarithmic scale settings, making chart interpretation both accurate and user-friendly. Traders can customize their charting experience with multiple styles and layouts, tailoring the interface to their preferences. These features underscore inteliCharts as a flexible platform for both novice and expert users.
Offline Access to Market Data
One of the standout features of inteliCharts is the ability to download historical data for any stock or index and save it locally in a SQL database. This means that users can access their data instantly even without an internet connection, a crucial benefit for those who need constant access to market information.
Predictive Analytics for Future Market Movements
In terms of forward-looking features, inteliCharts steps up with its Future Stock Value Predictive Analytics. This functionality calculates and plots possible future stock price ranges on the chart, offering a probabilistic view of market direction that can be instrumental for long-term investment planning.
Software Build and Compatibility
Built on the .NET framework and supporting SQL databases, inteliCharts assures stability and quick local data access. This compatibility and foundation suggest a reliable performance and the likelihood of regular updates to keep up with .NET advancements.
Pros
- Real-time intraday snapshot price information for up-to-date analysis
- Custom input parameters editor enhances indicator flexibility
- Advanced drawing tools with magnetic line features and logarithmic scales
- Accessible historical data stored locally for offline review
- Comprehensive technical analysis with over 70 indicators at no charge
- Predictive analytics for future price probability ranges
- Based on sturdy .NET framework with SQL database support
Cons
- The wealth of features might be overwhelming for beginners
- Predictive analytics are probabilistic and not a guarantee of market movements
- May require a learning curve to utilize the full range of tools effectively
inteliCharts is a well-rounded stock market charting software that fulfills the needs of individual and professional traders alike. Its array of technical analysis capabilities, combined with predictive analytics and strong offline functionality, positions it as a notable tool in the world of financial market analysis. With a strong technical foundation and free access to its comprehensive set of features, inteliCharts is a worthy contender for those seeking a robust, insightful, and versatile trading companion.


